Tamilnadu State Board New Syllabus Samacheer Kalvi 11th Maths Guide Pdf Chapter 1 Sets, Relations and Functions Ex 1.4 Text Book Back Questions and Answers, Notes.
Tamilnadu Samacheer Kalvi 11th Maths Solutions Chapter 1 Sets, Relations and Functions Ex 1.4
Question 1.
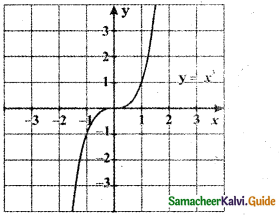
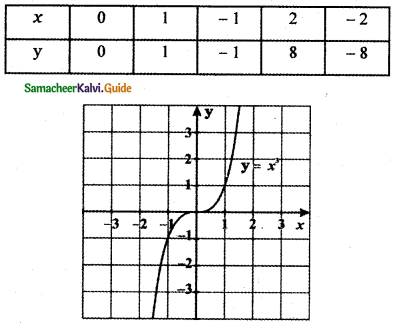
For the curve y = x3 given in figure below, draw
(i) y = – x3
(ii) y = x3 + 1
(iii) y = x3 – 1
(iv) y = (x + 1)3 with the same scale.
Answer:
(i) y = – x3
The graph y = – x3 is the reflection of the graph y = x3 about x-axis.
The graph of y = – f( x) is the reflection of the graph of y = f( x) about x – axis.
![]()
(ii) y = x3 + 1
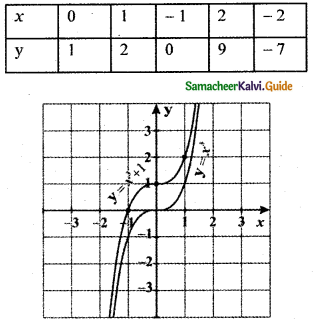
The graph of y = x3 + 1, causes the graph y = x3 a shift to the upward by 1 unit.
The graph of y = f(x) + d, d > 0 causes the graph y = f(x) a shift to the upward by d units.
(iii) y = x3 – 1
The graph of y = x3 – 1, causes the graph y = x3 a shift to the downward by 1 unit.
The graph of y = f(x) – d, d > 0 causes the graph y = f(x) a shift to the downward by d units.
![]()
(iv) y = (x + 1)0033
The graph y = (x + 1)3 causes the graph of y = x3 a shift to the left by 1 unit.
The graph of y = f(x + c), c > 0 causes the graph y = f(x) a shift to the left by c units.
Question 2.
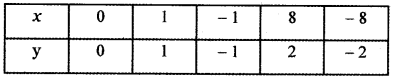
For the given curve y = x1/3 given in figure draw
(i) y = – x1/3
(ii) y = x1/3 + 1
(iii) y = x1/3 – 1
(iv) y = (x + 1)1/3
Answer:
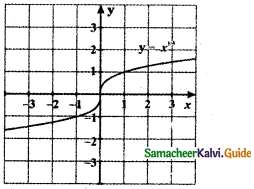
![]()
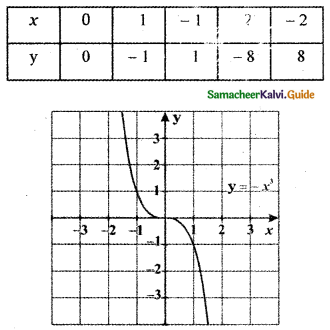
(i) y = – x1/3
-y = x1/3
(-y)3 = x
-y3 = x
When y = 0 ⇒ – 03 ⇒ x = 0
y = 1 ⇒ – 13 = x ⇒ x = – 1
y = 2 ⇒ – 23 = x ⇒ x = – 8
y = 3 ⇒ – 33 = x ⇒ x = – 27
y = -1 ⇒ – (-1)3 = x ⇒ x = 1
y = -2 ⇒ – (-2)3 = x ⇒ x = 8
y = -3 ⇒ – (- 3)3 = x ⇒ x = 27
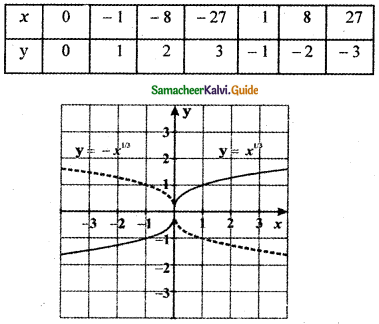
The graph of y = – x1/3 is the reflection of the graph of y = x1/3 about the x-axis.
The graph of y = – f(x) is the reflection of the graph of y = f(x) about x – axis.
![]()
(ii) y = x1/3 + 1
y – 1 = x1/3
⇒ (y – 1)3 = x
When
y = 0 ⇒ (0 – 1 )3 = x ⇒ x = – 1
y = 1 ⇒ (1 – 1)3 = x ⇒ x = 0
y = 2 ⇒ ( 2 – 1 )3 = x ⇒ x = 1
y = 3 ⇒ (3 – 1)3 = x ⇒ x = 8
y = -1 ⇒ (-1 – 1)3 = x ⇒ x = – 8
y = -2 ⇒ (-2 – 1)3 = x ⇒ x = – 27
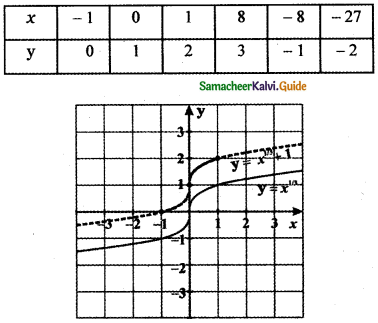
The graph of y = x1/3 + 1 causes the graph y = x1/3 a shift to the upward by 1 unit.
The graph of y = f(x) + d, d > 0 causes the graph y = f(x) a shift to the upward by d units.
![]()
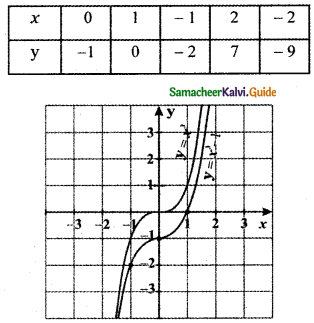
(iii) y = x1/3 – 1
y + 1 = x1/3
( y + 1)3 = x
When
y = 0 ⇒ (0 + 1)3 = x ⇒ x = 1
y = 1 ⇒ ( 1 + 1)3 = x ⇒ x = 8
y = 2 ⇒ (2 + 1)3 = x ⇒ x = 27
y = – 1 ⇒ (-1 + 1)3 = x ⇒ x = 0
y = – 2 ⇒ (-2 + 1)3 = x ⇒ x = – 1
y = – 3 ⇒ (-3 + 1)3 = x ⇒ x = – 8
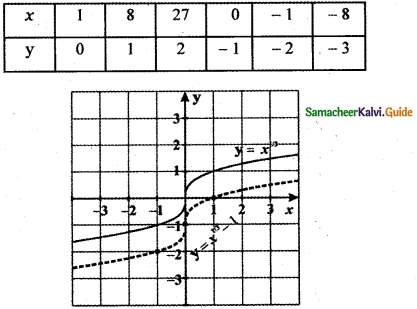
The graph of y = x1/3 – 1 causes the graph y = x1/3 a shift to the downward by 1 unit.
The graph of y = f(x) – d, d > 0 causes the graph y = f(x) a shift to the downward by d units.
![]()
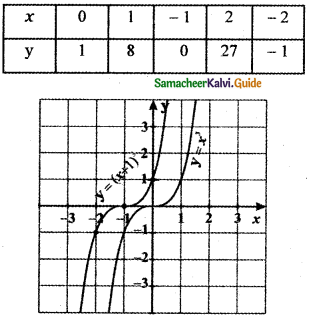
(iv) (x + 1)1/3
y3 = x + 1
When
y = 0 ⇒ 03 = x + 1 ⇒ x = -1
y = 1 ⇒ 13 = x + 1 ⇒ x = 0
y = 2 ⇒ 23 = x + 1 ⇒ x = 8 – 1 = 7
y = 3 ⇒ 33= x + 1 ⇒ x = 27 – 1 = 26
y = – 1 ⇒ (-1)3 = x + 1 ⇒ x = – 1 – 1 = – 2
y = -2 ⇒ (-2)3 = x + 1 ⇒ x = – 8 – 1 = – 9
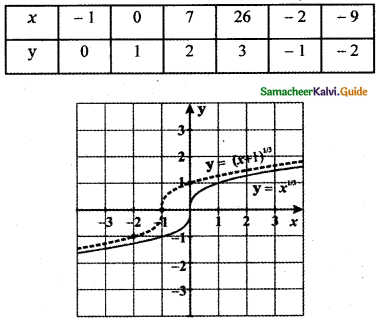
The graph of y = (x + 1)3 causes the graph y = x1/3 a shift to the left by 1 unit.
The graph of y = f(x + c), c > 0 causes the graph y = f(x) a shift to the left by c units.
![]()
Question 3.
Graph the functions f(x) = x3 and g (x) = \(\sqrt[3]{x}\) on the same coordinate plane. Find fog and the graph it on the plane as well. Explain your results.
Answer:
Given functions are f(x) = x3 and g(x) = x1/3
fog (x) = f(g(x))
= f\(\left(x^{\frac{1}{3}}\right)\)
= \(\left(x^{\frac{1}{3}}\right)^{3}\) = x
f(x) = x3
g(x) = x1/3
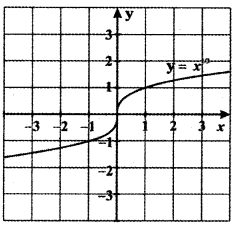
Graph of fog(x) = x
Since fog(x) = x is symmetric about the line y = x, g(x) is the inverse image of f(x).
∴ g(x) = f-1(x)
![]()
Question 4.
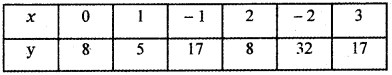
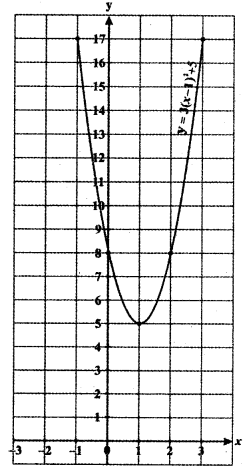
Write steps to obtain the graph of the function y = 3 (x – 1 )2 + 5 from the graph y = x2
Answer:
Step 1:
Draw the graph y = x2
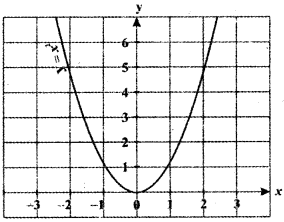
Step 2:
The graph of y = (x – 1)2 shifts to the right for one unit.
The graph of y = (x – 1 )2 shifts the graph
y = x2 to the right by 1 unit.
The graph of y = f(x – c), c > 0 causes the graph y = f(x) a shift to the right by c units.
![]()
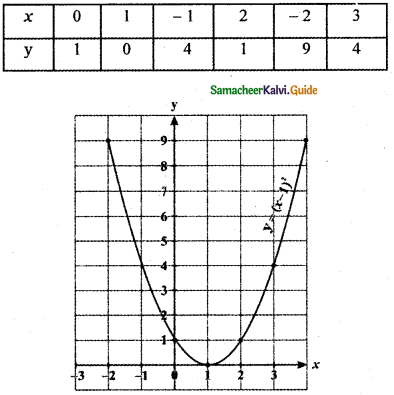
Step 3:
The graph of y = 3 (x – 1)2 compresses towards y – axis that is moves away from the x – axis since the multiplying factor is which is greater than 1.
The graph of y = 3 (x – 1)2 compresses the graph y = (x – 1)2 towards the y-axis that is moving away from the x-axis since the multiplying factor is greater than 1.
For the graph y = kf(x), If k is a positive constant greater than one, the graph moves away from the x-axis. If k is a positive constant less than one, the graph moves towards the x-axis.
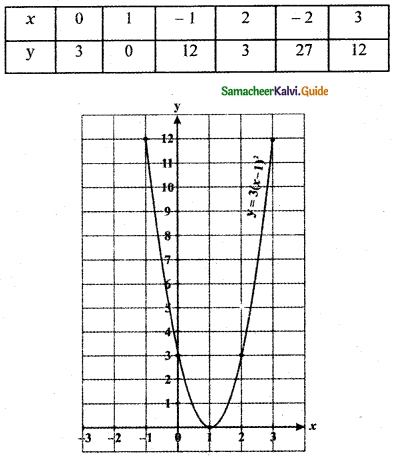
Step 4:
The graph of y = 3(x – 1)2 + 5 causes the shift to the upward for 5 units.
The graph of y = 3(x – 1)2 + 5 causes the graph y = 3(x – 1)2 shifts to the upward for 5 units.
The graph of y = f(x) + d, d > 0 causes the graph y = f(x) a shift to the upward by d units.
![]()
Question 5.
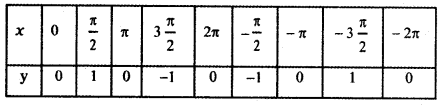
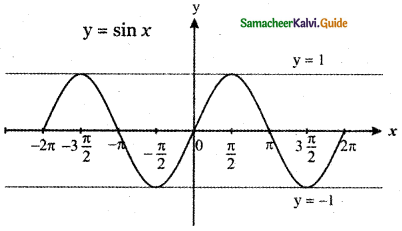
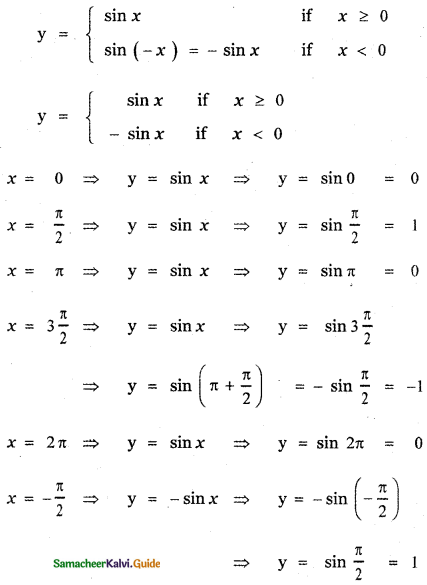
From the curve y = sin x, graph the functions.
(i) y = sin (- x)
(ii) y = -sin(-x)
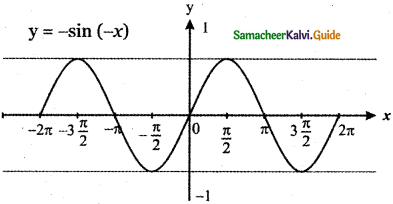
(iii) y = sin\(\left(\frac{\pi}{2}+x\right)\) which is cos x
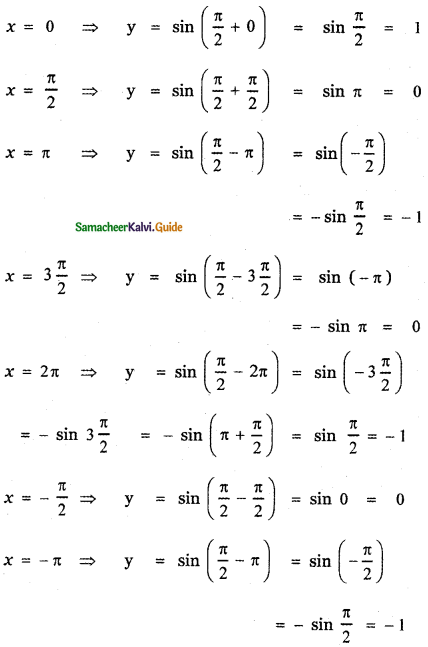
(iv) y = sin\(\left(\frac{\pi}{2}-x\right)\) which is also cos x
(Refer Trigonometry )
Answer:
y = sin x
(i) y = sin(-x)
y = – sin x
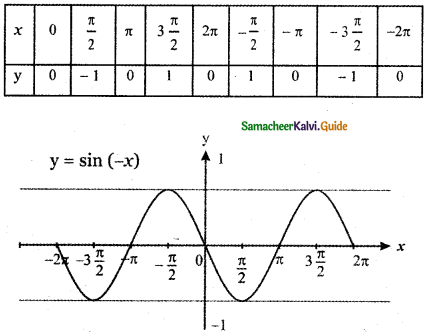
The graph of y = sin (- x) is the reflection of the graph of y = sin x about y-axis.
The graph of y = f(- x) is the reflection of the graph of y = f(x) about y – axis.
![]()
(ii) y = – sin (-x)
y = sin x
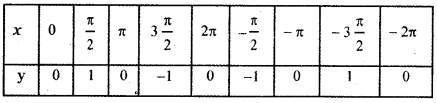
y = – sin (-x) is the reflection of y = sin (-x) about the x – axis.
The graph of y = – f( x) is the reflection of the graph of y = f( x) about x – axis.
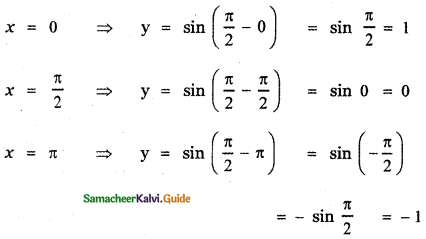
(iii) y = sin\(\left(\frac{\pi}{2}+x\right)\)
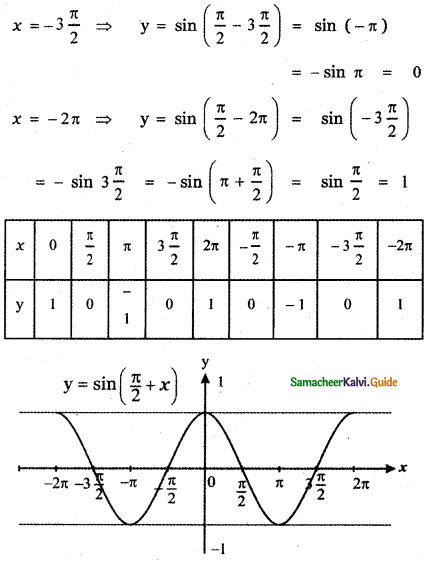
The graph of y = sin \(\left(\frac{\pi}{2}+x\right)\) causes y = sin x a shift to the left by \(\frac{\pi}{2}\) units.
The graph of y = f(x + c), c > 0 causes the graph y = f(x) a shift to the left by c units.
![]()
(iv) y = sin\(\left(\frac{\pi}{2}-x\right)\)
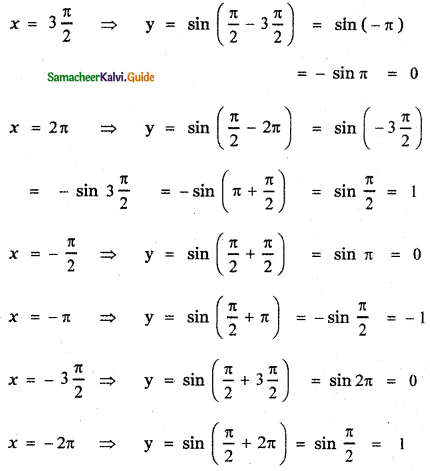
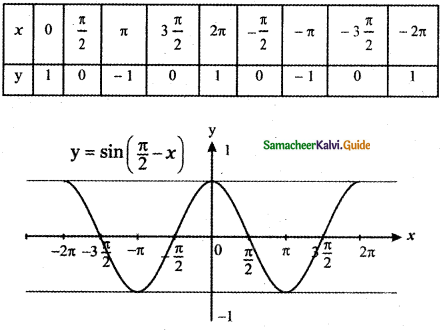
The graph of sin \(\left(\frac{\pi}{2}-x\right)\) causes the graph y = sin x a shift to the right by \(\frac{\pi}{2}\) unit.
The graph of y = f(x – c), c > 0 causes the graph y = f(x) a shift to the right by c units.
![]()
Question 6.
From the curve y = x draw
(i) y = -x
(ii) y = 2x
(iii) y = x + 1
(iv) y = \(\frac{1}{2}\)x + 1
(v) 2x + y + 3 = 0
Answer:
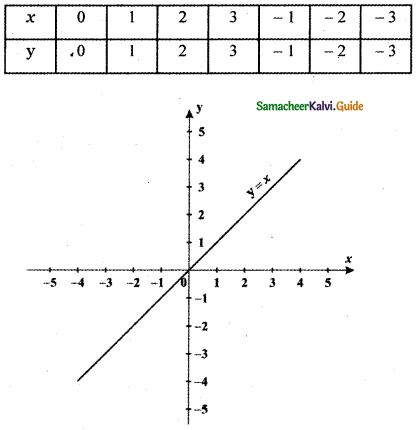
(i) y = -x
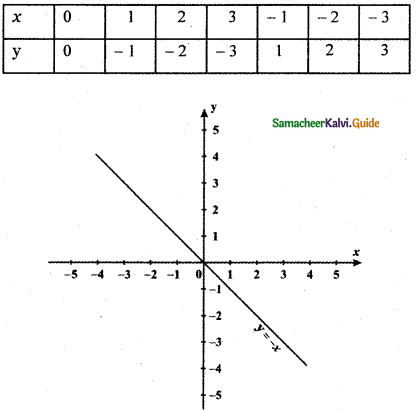
Graph of y = – x is the reflection of the graph of y = x about the x – axis.
The graph of y = – f(x) is the reflection of the graph of y = f(x) about x – axis.
![]()
(ii) y = 2x
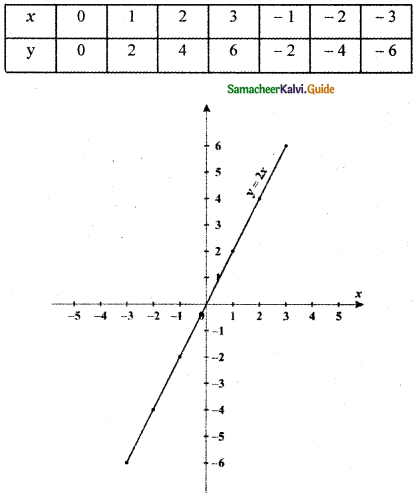
The graph of y = 2x compresses the graph y = x towards the y-axis that is moving away from the x-axis since the multiplying factor is 2 which is greater than 1.
The graph of y = k f(x), k > 0 moves away from the x-axis if k is greater than 1.
![]()
(iii) y = x + 1
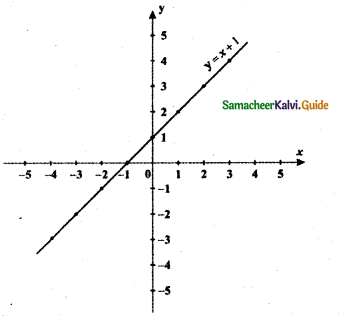
The graph of y = x + 1 causes the graph y = x shift to upward by 1 unit.
The graph of y = f(x) + d, d > 0 causes the graph y = f(x) a shift to the upward by d units.
![]()
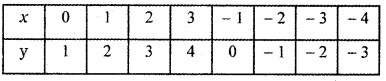
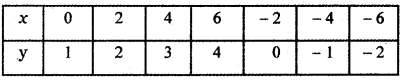
(iv) y = \(\frac{1}{2}\)x + 1
When
x = 0 ⇒ y = \(\frac{1}{2}\) × 0 + 1 = 1
x = 2 ⇒ y = \(\frac{1}{2}\) × 2 + 1 = 2
x = 4 ⇒ y = \(\frac{1}{2}\) × 4 + 1 = 2 + 1 = 3
x = 6 ⇒ y = \(\frac{1}{2}\) × 6 + 1 = 3 + 1 = 4
x = – 2 ⇒ y = \(\frac{1}{2}\) × – 2 +1= – 1 + 1 = 0
x = – 4 ⇒ y = \(\frac{1}{2}\) × – 4 + 1 = – 2 + 1 = – 1
x = – 6 ⇒ y = \(\frac{1}{2}\) × – 6 + 1 = – 3 + 1 = – 2
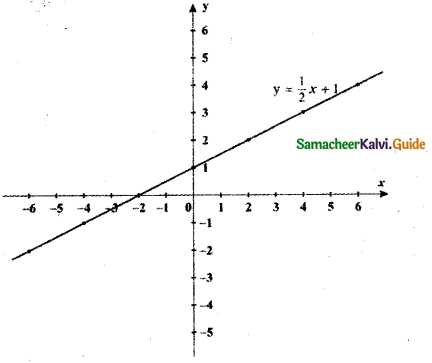
The graph of y = \(\frac{1}{2}\)x + 1 stretches the graph y = x towards the x – axis since the multiplying factor is \(\frac{1}{2}\) which is less than 1 and shifts to the upward by 1 unit.
The graph of y = kf(x), k > 0 moves towards the x-axis if k is less than 1.
The graph of y = f(x) + d, d >0 causes the graph y = f(x) a shift to the upward by d units.
![]()
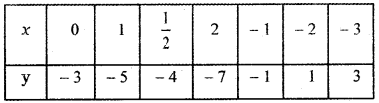
(v) 2x + y + 3 = 0
y = -2x – 3
When
x = 0 ⇒ y = -2 × 0 – 3 = -3
x = 1 ⇒ y = -2 × 1 – 3 = -5
x = \(\frac{1}{2}\) ⇒ y = – 2 × \(\frac{1}{2}\) – 3 = – 1 – 3 = – 4
x = 2 ⇒ y = -2 × 2 – 3 = – 4 – 3 = – 7
x = – 1 ⇒ y = -2 × – 1 – 3 = 2 – 3 = – 1
x = – 2 ⇒ y = 2 × – 2 – 3 = 4 – 3 = 1
x = – 3 ⇒ y = -2 × -3 – 3 = 6 – 3 = 3
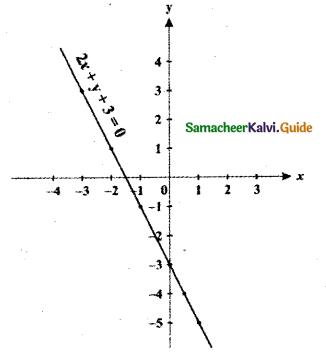
The graph of y = – 2x – 3 stretches the graph y = x towards the x-axis since the multiplying factor is – 2 which is less than 1 and causes the shift to the downward by 3 units.5
The graph of y = kf(x), k > 0 moves towards the x-axis if k is less than 1.
The graph of y = f(x) – d, d >0 causes the graph y = f(x) a shift to the downward by d units.
![]()
Question 7.
From the curve y = |x| draw
(i) y = |x – 1| + 1
(ii) y = |x + 1| – 1
(iii) y = |x + 2| – 3
Answer:
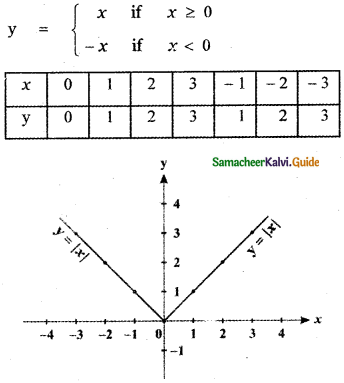
y = |x|
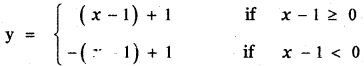
(i) y = |x – 1| + 1
(a) Consider y = |x – 1|
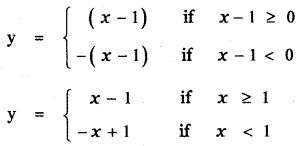
x = 0 ⇒ y = – x + 1 ⇒ y = 1
x = 1 ⇒ y = x – 1 ⇒ y = 0
x = 2 ⇒ y = x – 1 ⇒ y = 1
x = 3 ⇒ y = x – 1 ⇒ y = 2
x = – 1 ⇒ y = – x + 1 ⇒ y = 2
x = – 2 ⇒ y = – x + 1 ⇒ y = 3
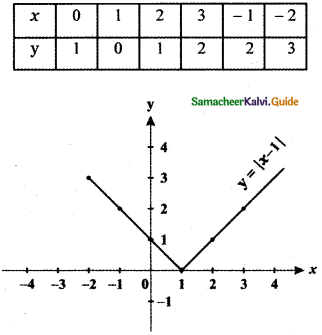
The graph of y = |x – 1| causes the graph y = |x| a shift to the right by 1 unit.
The graph of y = f(x – c), c > 0 causes the graph y = f(x) a shift to the right by c units.
![]()
(b) Consider y = |x – 1| + 1
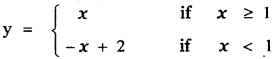
x = 0 ⇒ y = – x + 2 ⇒ y = 2
x = 1 ⇒ y = x ⇒ y = 1
x = 2 ⇒ y = x ⇒ y = 2
x = 3 ⇒ y = x ⇒ y = 3
x = – 1 ⇒ y = – x + 2 ⇒ y = 3
x = – 2 ⇒ y = – x + 2 ⇒ y = 4
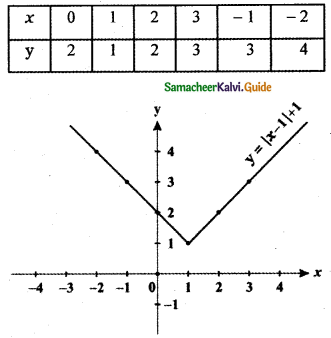
The graph of y = |x – 1| + 1 shift the graph y = |x| to the right by 1 unit and causes a shift to the upward by 1 unit.
The graph of y = f( x – c), c > 0 causes the graph y = f(x) a shift to the right by c units.
The graph of y = f(x) + d, d > 0 causes the graph y = f(x) a shift to the upward by d units.
![]()
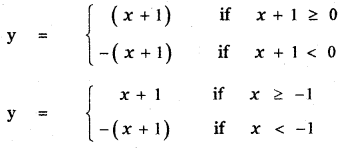
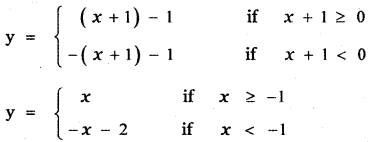
(ii) y = |x + 1| – 1
(a) Consider y = |x + 1|
x = 0 ⇒ y = x + 1 ⇒ y = 1
x = 1 ⇒ y = x + 1 ⇒ y = 2
x = 2 ⇒ y = x + 1 ⇒ y = 3
x = 3 ⇒ y = x + 1 ⇒ y = 4
x = – 1 ⇒ y = x + 1 ⇒ y = 0
x = – 2 ⇒ y = – (x + 1) ⇒ y = 1
x = – 3 ⇒ y = – (x + 1) ⇒ y = 2
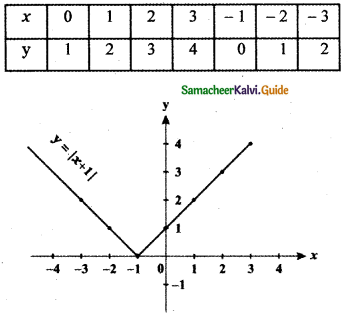
The graph of y = |x + 1| shifts the graph y = |x| to the left by 1 unit.
The graph of y = f( x + c), c > 0 causes the graph y = f(x) a shift to the left by e units.
![]()
(b) Consider y = |x + 1| – 1
x = 0 ⇒ y = x ⇒ y = 0
x = 1 ⇒ y = x ⇒ y = 1
x = 2 ⇒ y = x ⇒ y = 2
x = 3 ⇒ y = x ⇒ y = 3
x = – 1 ⇒ y = x ⇒ y = – 1
x = – 2 ⇒ y = – x – 2 ⇒ y = 0
x = – 3 ⇒ y = – x – 2 ⇒ y = 1
x = – 4 ⇒ y = – x – 5 ⇒ y = -1
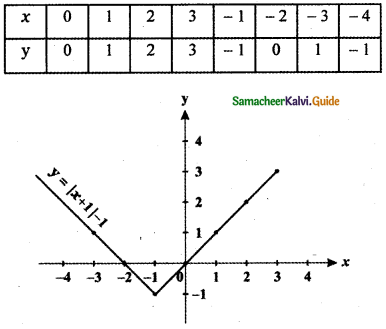
The Graph of y = |x + 1 | – 1 shift the graph y = |x| to the left by 1 unit and causes a shift downward by 1 unit.
The graph of y = f(x + c), c > 0 causes the graph y = f(x) a shift to the left by c units.
The graph of y = f(x) – d, d > 0 causes the graph y = f(x) a shift to the downward by d units.
![]()
(iii) y = |x + 2| – 3
(a) Consider the curve y = |x + 2|
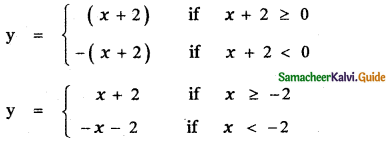
x = 0 ⇒ y = x + 2 ⇒ y = 2
x = 1 ⇒ y = x + 2 ⇒ y = 3
x = 2 ⇒ y = x + 2 ⇒ y = 4
x = 3 ⇒ y = x + 2 ⇒ y = 5
x = – 1 ⇒ y = x + 2 ⇒ y = 1
x = – 2 ⇒ y = x + 2 ⇒ y = 0
x = – 3 ⇒ y = – x – 2 ⇒ y = 1
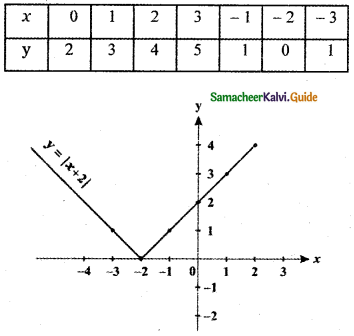
The graph of y = |x + 2| shifts the graph y = |x| to the left by 2 units.
The graph of y = f(x + c), c > 0 causes the graph y = f(x) a shift to the left by c units.
![]()
(b) Consider the curve y = |x + 2| – 3
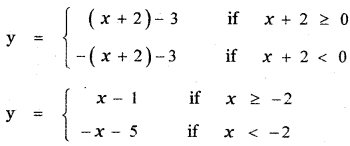
x = 0 ⇒ y = x – 1 ⇒ y = – 1
x = 1 ⇒ y = x – 1 ⇒ y = 0
x = 2 ⇒ y = x – 1 ⇒ y = 1
x = 3 ⇒ y = x – 1 ⇒ y = 2
x = – 1 ⇒ y = x – 1 ⇒ y = – 2
x = – 2 ⇒ y = x – 1 ⇒ y = – 3
x = – 3 ⇒ y = – x – 5 ⇒ y = – 2
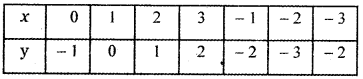
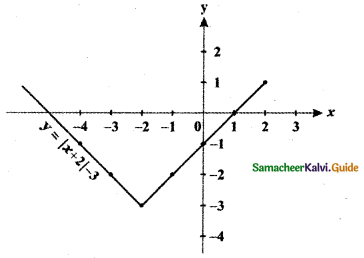
The graph of y = |x + 2| – 3 shifts the graph y = |x| to the left by 2 units and causes a shift downward by 3 units.
The graph of y = f(x + c), c > 0 causes the graph y = f(x) a shift to the left by c units.
The graph of y = f(x) – d, d > 0 causes the graph y = f(x) a shift to the down ward by d units.
![]()
Question 8.
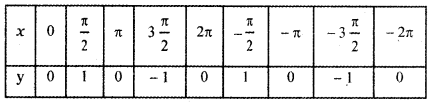
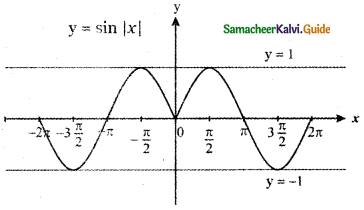
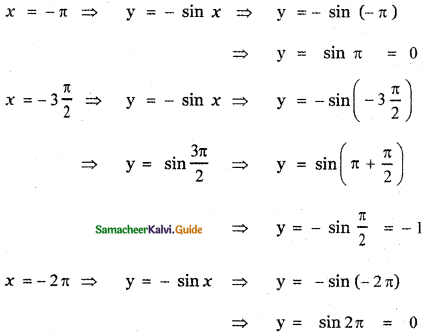
From the curve y = sin x, draw y = sin |x| (Hint: sin(- x) = – sin x)
Answer:
y = sin |x|
(a) y = sin x
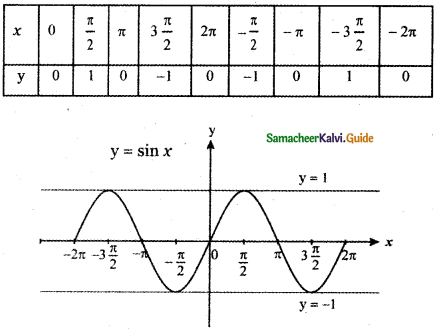
(b) Consider y = sin |x|
![]()