Tamilnadu State Board New Syllabus Samacheer Kalvi 9th Social Science Guide Pdf Geography Chapter 7 Mapping Skills Text Book Back Questions and Answers, Important Questions, Notes.
Tamilnadu Samacheer Kalvi 9th Social Science Solutions Geography Chapter 7 Mapping Skills
Samacheer Kalvi 9th Social Science Mapping Skills Text Book Back Questions and Answers
I. Choose the best answer.
Question 1.
The new phase in topographical surveying in the 20’h century is __________
(a) toposheets
(b) aerial photography
(c) maps
(d) satellite imagery
Answer:
(d) satellite imagery
![]()
Question 2.
indicates the purpose or theme of the map.
(a) Title
(b) Scale
(c) Direction
(d) Legend
Answer:
(a) Title
Question 3.
Standard symbols that are used in maps to convey a definite meaning are called __________
(a) conventional signs and symbols
(b) coordinates
(c) grid references
(d) directions
Answer:
(a) conventional signs and symbols
Question 4.
Which one of the following maps show us a very large area with less details?
(a) Large scale
(b) Thematic
(c) Physical
(d) Small scale
Answer:
(d) Small scale
![]()
Question 5.
GPS consists of a constellation of satellites.
(a) 7
(b) 24
(c) 32
(d) 64
Answer:
b) 24
II. Match the following
- The art and science of mapping – (a) USA
- Thematic mapping – (b) Geoid
- Actual shape of the earth – (c) Inmarsat
- A satellite – (d) Political map
- NAVSTAR – (e) Cartography
Answer:
- – (e)
- – (d)
- – (b)
- – (c)
- – (a)
III. Consider the given statements and choose the right option given below
Question 1.
Assertion (A): The points at which the vertical and horizontal lines of the grid intersect are called coordinates.
Reason (R): The lines that run horizontally and vertically are called Northings and Eastings respectively.
(a) Both (A) and (R) are true ; (R) explains (A)
(b) Both (A) and (R) are true ; (R) does not explain (A)
(c) (A) is correct; (R) is false
(d) (A) is false ; (R) is true
Answer:
(a) Both (A) and (R) are true ; (R) explains (A)
![]()
Question 2.
Assertion (A): The legend of a map does not help us to understand the information in a map.
Reason (R): It is usually placed at the left or right corner at the bottom of the map.
(a) (A) is false ; (R) is true
(b) Both (A) and (R) are true ; (R) does not explain (A)
(c) (A) is correct; (R) is false
(d) Both (A) and (R) are true ; (R) explains (A)
Answer:
(a) (A) is false ; (R) is true
IV. Answer in Brief.
Question 1.
Name the different methods to represent the Earth.
Answer:
The three methods in widest use are as follows:
- Projection on the surface of a cylinder
- Projection on to the surface of a cone
- Projection directly onto a flat plane called planar or zenithal or azimuthal projection.
Question 2.
What is a map?
Answer:
- A map is the basic tool of a geographer.
- It illustrates the earth’s surface clearly and effectively through a combination of drawings, words and symbols.
- Thus, maps form an integral part of teaching geography.
- A map is a location guide.
Question 3.
What are the three components of a map?
Answer:
Title, scale, and directions are the three components of a map.
Question 4.
The distance between the two cities A and B is 5 km. It is represented by a line of 5 cm on the map. Calculate the distance and give the answer in RF.
Answer:
Representative Fraction (R.F.) = \(\frac { Distance on the map }{ Distance on the ground }\) = \(\frac { 5 Cm }{ 5 km }\) = 1:1,00,000
![]()
Question 5.
Mention a few surveying instruments.
Answer:
Chain, Prismatic compass, Plane table, Dumpy level, Abney level, Clinometer, Theodolite, Total Station, and GNSS are some of the surveying instruments.
Question 6.
Define remote sensing.
Answer:
- Remote Sensing refers to the observation and measurement of earthly objects without touching them.
- ‘Remote’ means far away and ‘Sensing’ means observing or collecting information.
Question 7.
What are the components of remote sensing?
Answer:
Components of remote sensing are:
- Energy source
- Transmission path
- Target
- Sensor
V. Give Reasons.
Question 1.
Satellite imageries stimulate map making.
Answer:
- Cartographic object extraction from digital imagery is a fundamental operation for GIS updates.
- Remote sensing is a multidisciplinary technique of electronic and analog image acquisition and exploitation which includes aerial photography.
- The images thus acquired by remote sensing are further processed to extract the different features.
Question 2.
A map is the basic tool of a geographer.
Answer:
- It illustrates the earth’s surface clearly and effectively through a combination of drawings, words and symbols.
- Thus, maps form an integral part of teaching geography. A map is a location guide.
Question 3.
Grid references are essential to finding the exact location of places on a map.
Answer:
The location of a place can be simply defined by its latitude and longitude. In normal practice, the latitude is stated first, and then comes the longitude. The latitude and longitude of a place can be expressed in units of degree, minutes, and seconds.
A grid is a set of lines with alphanumeric codes for defining a location on a map in many topographical sheets. The lines that run horizontally from left to right of the map are known as northings, whereas, the lines that run vertically from the top to the bottom of the map are called eastings. The points at which the vertical and horizontal lines of the grid intersect are called coordinates which are identified by numbers or letters.
VI. Distinguish between the following
Question 1.
Globe and Map.
Answer:
Map:
- Gives a two-dimensional presentation of a region.
- It is easy to use and portable.
- The region can be easily identified.
- It presents a distributed view as it is flat.
Globe:
- Gives a three-dimensional presentation of the entire world.
- It is not that easy to carry.
- It is called duplicate earth.
- It is more accurate.
![]()
Question 2.
Large scale map and small scale map.
Answer:
Large Scale Map
- It shows only small area.
- But it shows in great detail.
Small Scale Map
- It shows a large area.
- But it shows in less detail.
Question 3.
Aerial photographs and Satellite imageries
Aerial photographs:
- Surveying can be planned and executed in a shorter time economically.
- It covers a small area and needs permission from authorities.
Satellite imageries:
- High cost of satellite systems. Takes at least 10 years to plan, construct test and launch.
- It allows a global coverage and does not require permission.
Question 4.
GIS and GPS
Answer:
GIS:
- The Geographic Information System is a computer program that process data linked to certain places or locations.
- GIS finds its strongest use in resources management, telecommunications and urban and regional planning.
GPS:
- The Global Position System is a network that locates certain places here on earth.
- Weather forecasting, earthquake monitoring and environmental protection can be done effectively by using GPS.
VII. Answer in paragraph
Question 1.
What do you mean by the term ‘scale of the map’? Explain its classification.
Answer:
Scale makes it possible to reduce the size of the whole earth to show it on a piece of paper. A scale is a ratio between the actual distance on the map to the actual distance on the ground. Scales can be represented in three methods. They are the Statement, Representative Fraction (R.F) and Linear or Graphical scale methods.
Statement scale
The statement scale describes the relationship of map distance to ground distance in words, such as one centimetre to ten kilometres. It is expressed as 1cm =10 km.
The Representative Fraction (R.F)
It describes the proportion or ratio of the map distance to ground distance. It is usually abbreviated as R.F. It is stated as 1/100000 (or) 1:100000. This means that one unit on the map represents 100,000 of the same unit on the ground. This unit may be an inch or a centimetre or any other linear measurement unit. Thus, Representative Fraction (R.F.) = Distance on the map/ Distance on the ground.
![]()
Question 2.
Write a note on directions with a relevant diagram.
Answer:
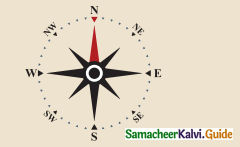
- Maps are drawn normally with north orientation.
- North direction in a map is always towards the North Pole of the earth.
- If you position yourself looking at the North Pole, on your right will be the east; your left will be the west; at your back will be south.
- These four main directions are called the cardinal directions.
- Direction is usually indicated on a map by a North-South line, with the North direction represented by an arrow head.
Question 3.
Explain the major uses of GPS? Explain about anyone.
Answer:
The Global Positioning System (GPS) is a U.S. owned utility that provides users with positioning, navigation, and timing services (PNT). This system consists of three segments: the space segment, the control segment, and the user segment.
Space Segment: This is formed by a Satellite Constellation with enough satellites to ensure that the users will have at least 4 simultaneous satellites in view from any point at the Earth Surface at any time.
Question 4.
Bhuvan has tremendous uses for scientists, policymakers, and the general public. Justify
Answer:
- Bhuvan (Sanskrit for Earth) is a free internet-based computer application launched by the Indian Space Research Organization (ISRO) on August 12th, 2009.
- It enables visualization of Indian Remote Sensing (IRS) images taken over a year ago, by ISRO’s seven satellites, including CartoSat-1 and CartoSat-2.
- Using Bhuvan connected to the Internet, one can explore places of interest, scenes of events in the news, or parts around the world they may never visit in person, by either entering the names of places or coordinates (latitudes and longitudes).
- Bhuvan has tremendous uses for scientists, academicians, policymakers, or the general public.
VIII. Map Exercise
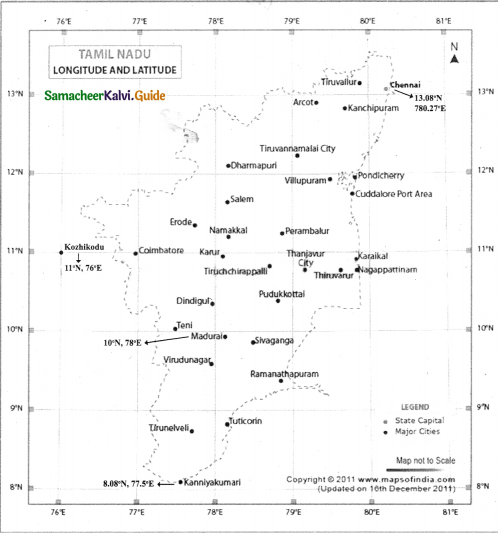
Question 1.
With the help of an atlas, mark the following on the outline map of Tamil Nadu.
(a) The latitude and longitude of Chennai.
(b) Mark the city located at 10° N, 78°E.
(c) Locate the city approximately on 11°N and 76°E.
(d) Find the latitude and longitude of Kanyakumari and mark it.
IX. HOTS
Question 1.
Can you imagine a world without satellites?
Answer:
No, we cannot imagine a world without satellites.
- Our lives would change in so many ways. Millions of people would be affected as they can’t speak through mobile phones or send messages, TV shows would be missed, important information cannot be passed on quickly, and so on.
- Scientific studies would be greatly restricted.
- Army people would face difficulty in coordinating for international operations.
- Spying would be impossible.
- There will be navigation issues, communication issues, etc.
![]()
Question 2.
Imagine you are a cartographer. Draw the map of your area.
Hints:
- Cartographers spend most of their time collecting and verily data used in creating maps.
- A Cartographer will also collect and analyze geographical data, such as population density, demographic characteristics, and animal precipitation patterns.
- As a cartographer, I will be involved with the scientific, technological, and artistic aspects of developing and producing maps.
- It will present complex information as diagrams, charts, and spreadsheets as well as in the form of conventional maps.
- A map of the area is to be drawn by the student.
Intext Activity
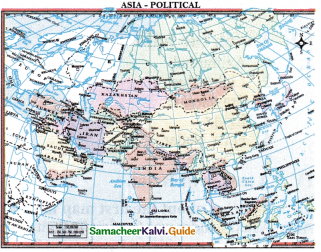
Question 1.
Imagine you are standing in India facing north, find in which direction are the following located using the map given below
Answer:
- Saudi Arabia West
- Myanmar East
- China North
- Indian ocean South
- Kazakhstan North
- Sumatra South East
- Afghanistan West
Samacheer Kalvi 9th Social Science Mapping Skills Additional Important Questions and Answers
I. Choose the best answer
Question 1.
The foundation for map-making in Indian war laid during the period ______
(a) Aryan
(b) Vedic
(c) Gupta
(d) Chola
Answer:
(b) Vedic
![]()
Question 2.
International boundaries are marked in ______ colour codes.
(a) Brown
(b) Blue
(c) Red
(d) Pink
Answer:
(d) Pink
Question 3.
A synoptic chart means
(a) Weather map
(b) Travelogue
(c) Thematic map
(d) General maps
Answer:
(a) Weather map
Question 4.
Aerial photographs were taken by Felix Nadar in __________
(a) 1850
(b) 1852
(c) 1858
(d) 1860
Answer:
(c) 1858
Question 5.
GPS technology has tremendous applications in __________
(a) Mobile phones
(b) Watches
(c) ATMs
(d) All the these
Answer:
(d) All the these
II. Consider the given statements and choose the right option given below.
Question 1.
Assertion (A): GNSS promotes the safety and convenience of transport.
Reason (R): GNSS applications are used in tracking or mapping vehicles, ships, and aircraft.
(a) Both (A) and (R) are true; (R) explains (A)
(b) Both (A) and (R) are true; (R) does not explain (A)
(c) (A) is correct; (R) is False
(d) (A) is false; (R) is true
Answer:
(a) Both (A) and (R) are true; (R) explains (A)
![]()
Question 2.
Statement (I): Surveying is done to measure the angle, direction, area, height and distance of an object.
Statement (II): A topographical map is the technique of meteorologists to display all the weather data.
(a) Statement (I) is true; (II) is false
(b) Statement (II) is true; (I) is false
(c) Statement (I) and (II) correct
(d) Statement (I) and (II) Wrong
Answer:
(a) Statement (I) is true; (II) is false
III. Match the following
- Azimuthal – (a) Water towers
- Light Blue – (b) Rope – stretchers
- Travelogue – (c) Journalist
- Egypt – (d) Polar projection
- Felix Nadar – (e) Tourist map
Answer:
- – (d)
- – (a)
- – (e)
- – (b)
- – (c)
IV. Answer in Brief.
Question 1.
Give a short account of ‘Imago Mundi’ the Babylonian Map of the World.
Answer:
More commonly known as the Babylonian Map of the World, the Imago Mundi is considered the oldest surviving world map. It is currently on display at the British Museum in London. It dates back to between 700 and 500 BC(BCE) and was found in a town called Sippar in Iraq.
The carved map depicts Babylon at the centre. Nearby are places like Assyria and Elam, all surrounded by a “Salt Sea” forming a ring around the cities. Outside the ring, eight islands or regions are carved onto the tablet. The map is accompanied by a cuneiform text describing Babylonian mythology in the regions depicted on the stone.
![]()
Question 2.
Who is a cartographer?
Answer:
A cartographer is one who measures, analyzes and interprets geographical information to create ‘ maps and charts for political, cultural and educational purposes.
Question 3.
Mention the three types of map symbols.
Answer:
- Point Symbols – Buildings, dipping tanks, trigonometrical beacons
- Line Symbols – Railways, roads, power lines, telephone lines
- Area Symbols – Cultivated lands, ponds, orchards and vineyards
Question 4.
What is a travelogue?
Answer:
A travelogue includes all the information required by a tourist like communication, transportation, hotels, tourist spots, health centres, ATMs, petrol stations etc.
Question 5.
Name the three types of Map Symbols.
Answer:
There are three types of map symbols;
- Point Symbols – buildings, dipping tanks, trigonometrical beacons
- Line Symbols – railways, roads, power lines, telephone lines
- Area Symbols – Cultivated lands, ponds, orchards, and vineyards
Question 6.
Mention the disadvantages of Remote sensing.
Answer:
- It is difficult to prepare large scale maps from obtained satellite data.
- The technique is very expensive for small areas requiring one-time analysis.
Question 7.
Mention the advantages of GIS.
Answer:
The advantages of GIS are
- Maps produced by GIS analysis can be used to pinpoint problem areas.
- GIS finds its strongest use in resources management, telecommunications, and urban and regional planning.
- GIS helps in planning the land-use requirements. The local government uses GIS for taxation and planning.
Question 8.
Write about the hardware and software functions of a GIS.
Answer:
The hardware and software functions of a GIS are,
- Data input and verification
- Compilation
- Storage
- Updating and changing
- Management and exchange
- Manipulation
- Retrieval and presentation
- Analysis and combination
Question 9.
What is meant by cybercartography?
Answer:
Cyber cartography is a term that is used to define all the aspects of the current state of Web and virtual mapping.
Question 10.
What is a survey?
Answer:
Surveying is done to measure the angle, direction, area, height and distance of an object or place on the surface of the earth using instruments. Surveying techniques are used to obtain the field data and to prepare maps. Knowledge of surveying helps one in map-making, particularly in the preparation of physical maps.
Question 11.
What are the advantages of Bhuvan?
Answer:
- Bhuvan, due to 3D rendering, gives the impression of moving through real space through the entire globe.
- Students can use Bhuvan to understand subjects ranging from Sciences to History of places.
- It provides information on natural resources and timely information on disasters.
- Administrators use it for monitoring various developmental schemes.
V. Give Reasons
Question 1.
“It is not possible to show all the data of an area on a map”.
Answer:
The details that are to be shown may vary according to requirement. Therefore, it is essential to consider the scale and purpose while preparing maps.
![]()
Question 2.
Surveys help to prepare physical maps.
Answer:
- Surveying is done to measure the angle, direction, area, height and distance of an object or place on the surface of the earth using instruments.
- Surveying techniques are used to obtain the field data and to prepare maps.
- Hence knowledge of surveying helps to prepare physical maps.
VI. Answer in paragraph
Question 1.
Write a note on Grid reference.
Answer:
- The location of a place can be simply defined by its latitude and longitude.
- In normal practice, latitude is stated first and then comes the longitude.
- The latitude and longitude of a place can be expressed in units of degree, minutes and seconds.
- A grid is a set of lines with alphanumeric codes for defining a location on a map in many topographical sheets.
- The lines that run horizontally from left to right of the map are known as northings.
- The lines that run vertically from the top to the bottom of the map are called eastings.
- The points at which the vertical and horizontal lines of the grid intersect are called coordinates which are identified by numbers or letters.
Question 2.
What are the colour codes used with map symbols?
Answer:
- Brown: land or earth features – contour lines, eroded areas, prominent rock outcrops, sand areas and dunes, secondary or gravel roads
- Light Blue: water features – canals, coastlines, dams, lakes, marshes, swamps and levees, ponds, rivers and water towers.
- Dark Blue: national waterways
- Green: vegetation features – cultivated fields, golf courses, nature and game reserve boundaries, orchards and vineyards, recreation grounds, woodland
- Black: construction features – roads, tracks, railways, buildings, bridges, cemeteries, communication towers, dam walls, excavations and mine dumps, telelphone lines, power lines, windpumps, boundaries
- Red: construction features – national, arterial and main roads, lighthouses and marine lights
- Pink: international boundaries
Question 3.
Explain the types of maps.
Answer:
(a) On the basis of scale, maps can be classified into:
- Large scale maps: Large amount of detail; can only show a small area.
- Small scale map: Small amount of detail; can show a large area,
(b) On the basis of utility and purpose, they are classified as:
- General maps / Topographic Maps (physical and political maps)
- Thematic map (spatial variations of single phenomena)
- Special purpose maps (Braille maps for blind people, maps for neo literates, military maps, navigational charts, etc).
Question 4.
Write a short note on
(a) Topographical Maps and
(b) Weather Maps
Answer:
(a) Topographical Maps
- Topographical maps show main features like landforms, water features, forests, settlements, agricultural fields, other land use, transportation and communication networks.
- These maps are general purpose maps and are drawn at quite large scales.
- The Survey of India prepares the topographical maps in India for the entire country.
(b) Weather Maps
- A weather map is the technique of meteorologists to display all the weather data recorded at various stations of a country at a particular point of time into a compact outline map using symbols and isolines.
- A weather map, otherwise called a synoptic chart, helps in weather analysis and weather forecast of the country/region for the next two to three days.
Question 5.
Explain the process of remote sensing.
Answer:
Remote Sensing
- The EMR (Electro-Magnetic Radiation) or solar radiation is the primary source of energy for remote sensing.
- Sunlight travels from the sun through the atmosphere, before it reaches the earth’s surface. In the atmosphere, the sun’s rays are not obstructed by any object.
- When solar radiation falls on the earth’s surface, some of its energy is absorbed. While some is transmitted through the surface, the rest is reflected. Surfaces naturally emit radiation in the form of heat.
- Sensors in the satellite record the reflected and emitted radiation. Each surface/object possesses a characteristic spectral signature, a unique pattern of reflecting sunlight.
- The energy recorded by the sensor has to be transmitted to a ground station where the data are processed into an image.
- The processed image is interpreted either visually by human interpreters or by computer-aided techniques called digital image processing to identify and distinguish between the different spectral signatures to get information about objects/places.
- Finally, we understand and apply the extracted information in mapping the area or assist in solving a particular problem.
![]()
Question 6.
What are the advantages and disadvantages of Remote Sensing?
Answer:
(a) Advantages of Remote sensing:
- It is the only practical way to obtain data from inaccessible regions, e.g. Antarctica, Amazon forest.
- It helps in constructing cheap base maps in the absence of detailed land surveys.
- It detects the spread of natural calamities such as floods, forest fires, and volcanic eruptions so that immediate rescue operations and planning can be carried out.
(b) Disadvantages of Remote sensing:
- It is difficult to prepare large scale maps from obtained satellite data.
- The technique is very expensive for small areas requiring one-time analysis.
Question 7.
How is remote sensing useful in disaster management?
Answer:
- Remote sensing technology is highly used in disaster management to study the effects of earthquakes, tsunamis, cyclones, volcanic eruption, floods, and wildfires.
- The preliminary data is retrieved from satellites like LANDSAT, CARTOSAT, OCEANSAT, etc.
- Fire and flood details can be extracted and delivered to relevant authorities within two hours of satellite image capture.
- E.g. major earthquakes in China and New Zealand, bushfire in Victoria, and floods in Kerala.
- Dynamic phenomena such as floods, movement of wild animals, shoreline changes, finding lost ships, and planes.
- Researchers use satellite imageries for these.
Question 8.
Explain the Global Navigation Satellite System (GNSS).
Answer:
- In the 21st century, GNSS has become a part of our lives to promote the safety and convenience of transport.
- Global Navigation Satellite System (GNSS) is a satellite system connected with a small electronic receiver or tracker to locate, monitor and track a user’s vehicle wherever in the world.
- It can also set up instant alerts when a driver of a vehicle speeds or deviates from a particular area.
- GNSS applications are used in tracking or mapping vehicles, ships and aircraft.
- group of satellites (Space Segment) working with a network of ground stations (Control Segment) provide location data.
- The receiver (User Segment) converts satellite signals into location, speed and time data
- Examples of GNSS:
- Europe’s Galileo
- USA’s NAVSTAR Global Positioning System (GPS)
- Russia’s Global’naya Navigatsionnaya Sputnikovaya Sistema (GLONASS)
- China’s BeiDou Navigation Satellite System
- India’s NAVIC satellite system
Question 9.
Explain the Geographical Information System (GIS).
Answer:
- Geographic Information System is a computer-based tool for managing a large amount of data collected for a given geographic region through remote sensing, GPS, and other sources.
- The Geographic Information’System is a combination of computer hardware, software, geographic data, and personnel.
- G – Geographic – A particular area; I – Information – facts in order; S – System – arrangement
- GIS was first recognised in the late 1950s by Waldo Tobler and Roger Tomlinson (Canada).
- Prime examples of importing GIS for public welfare are Google Maps, Yahoo Maps, and Google Earth.
- The key ingredient is the location. We must have a coordinate, an address, or a distance from a known point that helps us to link the information to a location on a map.
- Each type of data of an area is stored as a separate ‘layer’ of the map.
- In GIS, layers may be used some times and removed according to need.
- Examples are hospitals, schools, water bodies, parks, and ATMs.
- The computers can create maps showing any combination of data.
![]()
Question 10.
Write a note on Google Earth.
Answer:
- Google Earth is a web-based computer application.
- Google Earth is a virtual globe that renders a 3D representation of the Earth.
- It combines the power of Google Search with maps, satellite imageries, aerial photographs, GIS data, and 3D buildings to visualize the world.
- Google Earth allows users to see cities and buildings looking perpendicularly down or at a tilted angle.
- Google Earth allows users to search for addresses of some countries, enter coordinates, or simply use the mouse to browse a location.
- Google Earth also has a Digital Elevation Model (DEM) data for many major cities.
- This means one can view Mount Everest or buildings in three dimensions, instead of 2D.
![]()
Question 11.
Distinguish between Airborne remote sensing and spaceborne remote sensing.
Answer:
Airborne remote sensing:
- In airborne remote sensing, downward or sideward looking sensors are mounted on an aircraft to obtain images of the earth’s surface.
- An advantage of airborne remote sensing is the capability of offering very high spatial resolution images (20 cm or less)
Spaceborne remote sensing:
- In space-borne remote sensing, sensors are mounted on board a spacecraft (space shuttle or satellite) orbiting the earth.
- At present their one several remote sensing satellites proving imagery for research and operational applications.