Tamilnadu State Board New Syllabus Samacheer Kalvi 8th Maths Guide Pdf Chapter 6 Statistics Ex 6.3 Text Book Back Questions and Answers, Notes.
Tamilnadu Samacheer Kalvi 8th Maths Solutions Chapter 6 Statistics Ex 6.3
Miscellaneous Practice Problems
Question 1.
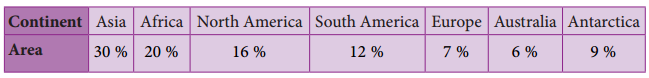
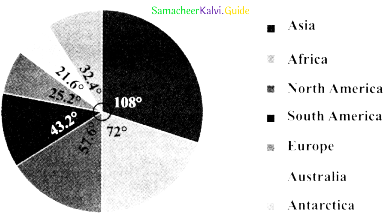
Draw a pie chart for the given table.
Answer:
Converting the area in percentage into components parts of 360°. we have.
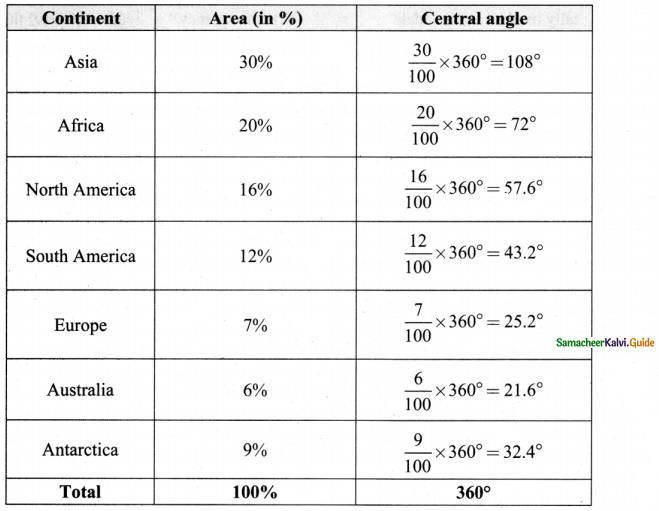
Continental Area.
![]()
Question 2.
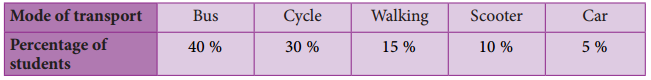
The data on modes of transport used by the students to come to school are given below. Draw a pie chart for the data.
Answer:
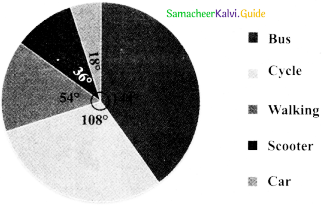
Converting the percentage into components parts of 360°. we have
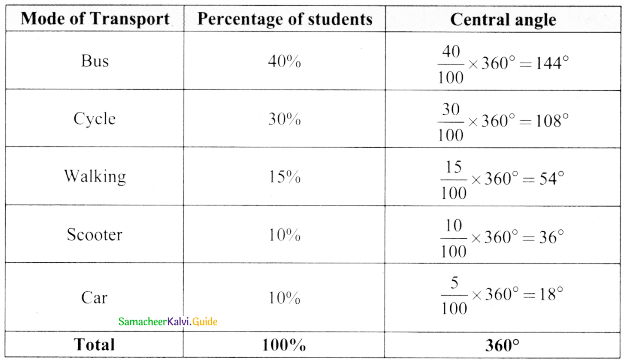
Mode of Transport by students.
![]()
Question 3.
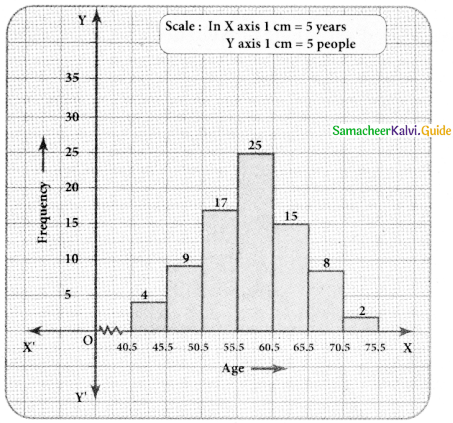
Draw a histogram for the given frequency distribution.

Answer:
The given distribution is discontinuous.
Lower boundary = lower limit – \(\frac { 1 }{ 2 }\) (gap between the adjacent class interval)
= 41 – \(\frac { 1 }{ 2 }\)(1) = 40.5
Upper boundary = Upper limit + \(\frac { 1 }{ 2 }\) (gap between the adjacent class interval)
= 45 + \(\frac { 1 }{ 2 }\)(1) = 45.5
Now continuous frequency table is as below

![]()
Question 4.
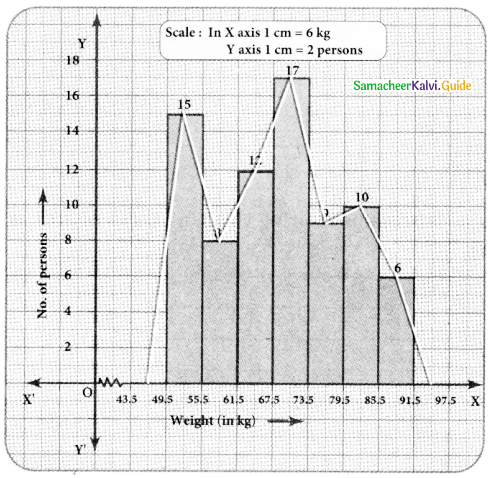
Draw a histogram and the frequency polygon in the same diagram to represent the following data.

Answer:
The given distribution is discontinuous.
Lower boundary = lower limit – \(\frac { 1 }{ 2 }\) (gap between the adjacent class interval)
= 50 – \(\frac { 1 }{ 2 }\)(1) = 49.5
Upper boundary = Upper limit + \(\frac { 1 }{ 2 }\)(gap between the adjacent class interval)
= 55 + \(\frac { 1 }{ 2 }\)(1) = 55.5
∴ The continuous frequency table is as below.

![]()
Challenging problems
Question 5.
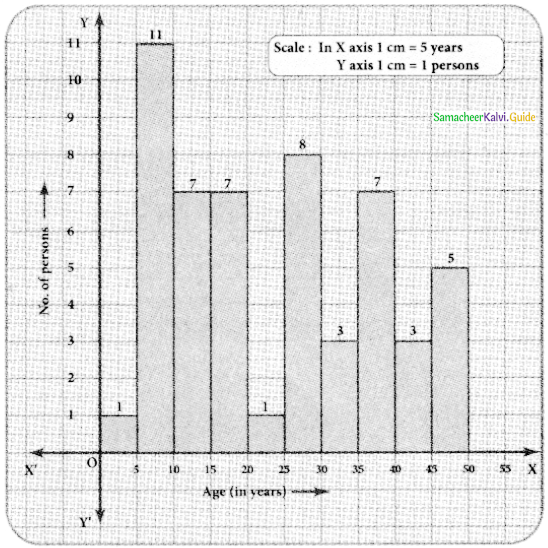
Form a continuous frequency distribution table and draw histogram from the following data.
| Age (in years) | No of persons |
| Under 5 | 1 |
| Under 10 | 12 |
| Under 15 | 19 |
| Under 20 | 26 |
| Under 25 | 27 |
| Under 30 | 35 |
| Under 35 | 38 |
| Under 40 | 45 |
| Under 45 | 48 |
| Under 50 | 53 |
Answer:
Converting into continuous distribution we have
| Class interval | No. of persons |
| 0 – 5 | 1 |
| 5 – 10 | 11 |
| 10 – 15 | 7 |
| 15 – 20 | 7 |
| 20 – 25 | 1 |
| 25 – 30 | 8 |
| 30 – 35 | 3 |
| 35 – 40 | 7 |
| 40 – 45 | 3 |
| 45 – 50 | 5 |
| Total | 53 |
![]()
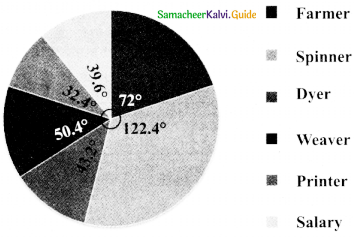
Question 6.
A rupee spent in a cloth manufacturing company is distributed as follows. Represent this in a pie chart.
| Particulars | Paise |
| Farmer | 20 |
| Spinner | 35 |
| Dyer | 15 |
| Weaver | 15 |
| Printer | 05 |
| Salary | 10 |
Answer:
1 Rupee = 100 paise.
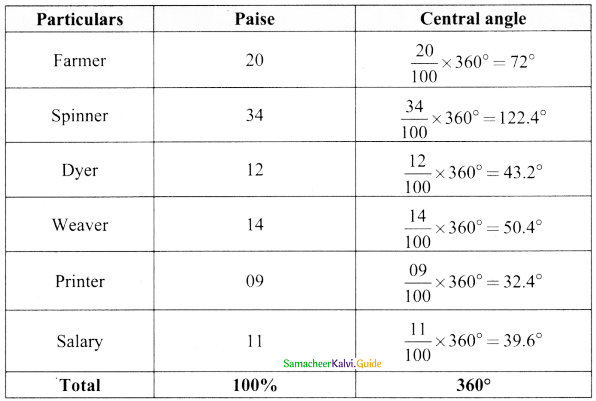
Expenditure of a cloth manufacturing company.
![]()
Question 7.
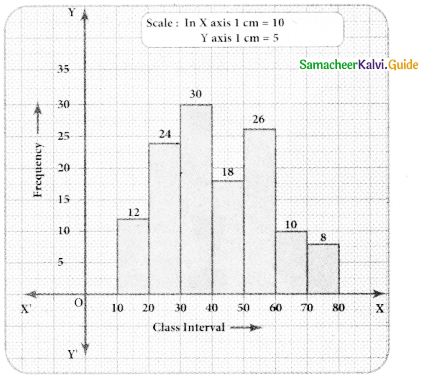
Draw a histogram for the following data.

Answer:
Since mid values are given, the given distributors is discontinuous.
Lower boundary lower limit – \(\frac { 1 }{ 2 }\)(gap between the adjacent class interval)
= 15 – \(\frac { 1 }{ 2 }\)(10) = 10
Upper boundary = Upper limit + (gap between the adjacent class interval)
= 15 + \(\frac { 1 }{ 2 }\)(10) = 20
The continuous distribution will he as folIows.