TN State Board 12th Economics Important Questions Chapter 12 Introduction to Statistical Methods and Econometrics
Question 1.
What is Statistics?
Answer:
- Statistics as a science of estimates and probabilities – Boddington.
- Statistics may be defined as the collection, organisation, presentation, analysis and interpretation of numerical data – Croxton and Cowden.
Question 2.
What are the kinds of Statistics?
Answer:
There are two major types of statistics named as
- Descriptive statistics and
- Inferential statistics.
Question 3.
What do you mean by Inferential Statistics?
Answer:
The branch of statistics concerned with using sample data to make an inference about a population of data is called inferential statistics.
![]()
Question 4.
What are the kinds of data?
Answer:
In statistics, data are classified into two broad categories. They are
- Quantitative data and
- Qualitative data.
Question 5.
Define Correlation.
Answer:
Correlation is a statistical device that helps to analyse the covariation of two or more variables. Sir Francis Galton is responsible for the calculation of correlation coefficient.
Question 6.
Define Regression.
Answer:
Regression is the study of the relationship between the variables. The literal meaning of the word “regression” is “stepping back towards the average”.
![]()
Question 7.
What is Econometrics?
Answer:
Econometrics may be considered as the integration of economics, statistics and mathematics. Econometrics means economic measurement. Econometrics deals with the measurement of economic relationship.
Question 8.
What are the functions of Statistics?
Answer:
- Statistics presents the facts in a definite form
- It implies mass of figures
- It facilitates comparison
- It helps in formulating and testing
- It helps in prediction
- It helps in the formulation of suitable policies.
![]()
Question 9.
Find the Standard Deviation of the following data: 14,22,9,15,20,17,12,11.
Answer:
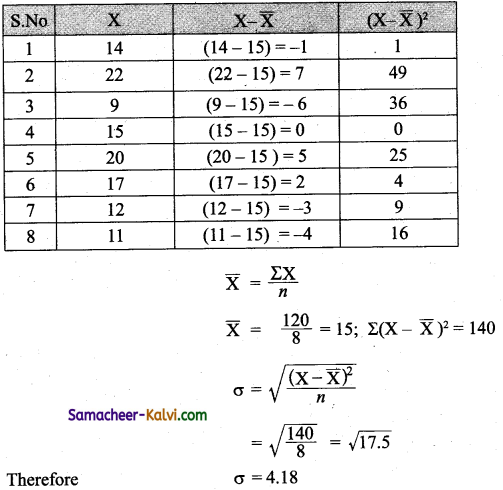
Question 10.
State and explain the different kinds of Correlation.
Answer:
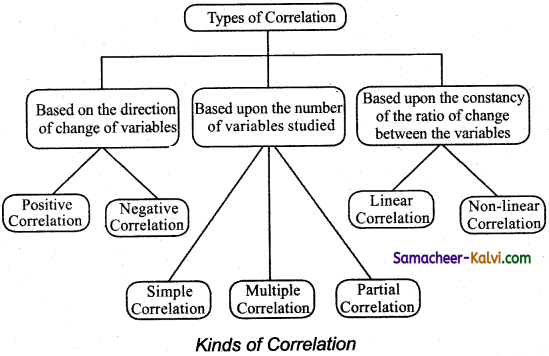
![]()
Question 11.
Mention the uses of Regression Analysis.
Answer:
The regression equation is used to estimate the value of Y corresponding to the known value of X. The line describing this tendency to regress or going back is called by Gabon as “Regression line”.
Question 12.
Specify the objectives of econometrics.
Answer:
- It helps to explain the behaviour of a forth coming period that is forecasting economic phenomena.
- It helps to prove the odd and established relationship among the variables or between the variables.
- It helps to establish the new theories and new relationships.
- It helps to test the hypotheses and estimation of the parameter.
Question 13.
Differentiate the economic model with econometric model.
Answer:
|
Economic model |
Econometric model |
| It is a local representation of knowledge. | It is an integration at dependent variable with explanatory variables to analyse the particular economic activity. |
| It is used for formulating the economic process at work. | It is used activity to a particular situation. |
| It is based on Economic laws and theory. | This is based on econometric investigation. |
![]()
Question 14.
Discuss the important statistical organizations (offices) in India.
Answer:
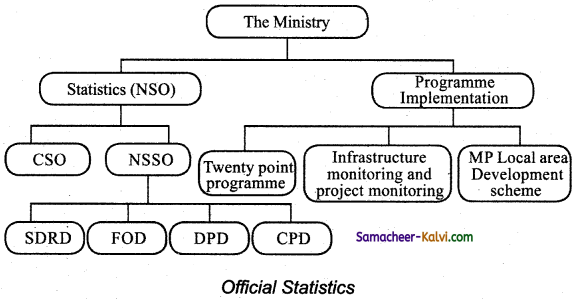
Question 15.
Elucidate the nature and scope of Statistics.
Answer:
Statistics is both as a science as well as an art in nature.
Scope: statistics are applied in every sphere of human activity.
(i) Statistics and economics:
It is useful in solving many economical problems.
Eg: Fluctuations in wages, prices, production and distribution of income.
(ii) Statistics and firms: It is used to confirm specifications of the product.
(iii) Statistics and commerce:
It is life blood of commerce.
Eg: Market survey to forecast future.
(iv Statistics and education:
It is useful to formulate policies to start new course according a changing environment.
(v) Statistics and planning:
Indispensable in planning. It is the statistical techniques are used for processing analysing and interpreting data both at Central and State Government.
(vi) Statistics and medicine:
Statistical tools are widely used in medicine.
Eg: To test the efficiency of a new drug. (T – Test)
(vii) Statistics and modern applications:
Especially in the field of computer and information technology, statistics is used.
![]()
Question 16.
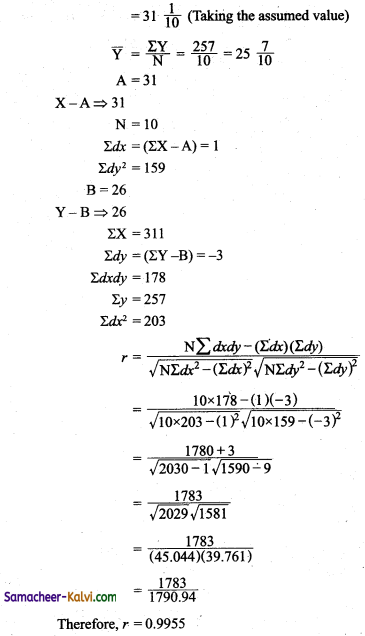
Calculate the Karl Pearson Correlation Co-efficient for the following data.

Answer:
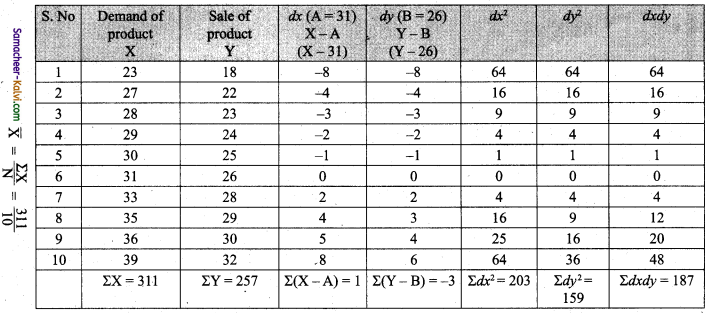
![]()
Question 17.
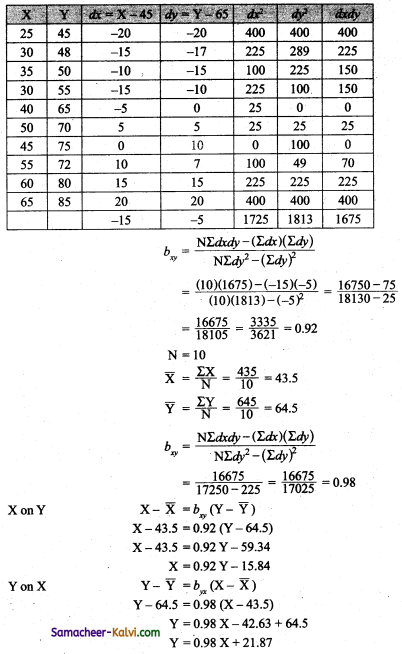
Find the regression equation for Y on X on Y for the following data:

Answer:
Question 18.
Describe the application of Econometrics in Economics.
Answer:
Econometrics means economic measurements. Econometrics deals with the measurement of economic relationship.
Objectives of econometrics:
The general objectives of econometrics is to give empirical content to economic theory.
(a) Econometrics is applied in statistics and it is economic statistics
(b) Economics + Maths = Mathematical Economics
(i) Econometrics helps to explain the behaviour of a forthcoming period that is forecasting economic phenomena.
(ii) It helps to improve the old and established relationships among the variables or between the variables.
(iii) It helps to establish new theories and new relationships in economics.
(iv) Econometrics helps to test the hypotheses and estimation parameter. So econometrics as a combination of maths and statistics, applied in various fields of economics.
![]()
Multiple Choice Questions:
Question 1.
The word ‘statistics’ is used as:
(a) Singular
(b) Plural
(c) Singular and Plural
(d) None of above
Answer:
(c) Singular and Plural
Question 2.
Who stated that statistics as a science of estimates and probabilities?
(a) Horace Secrist
(b) R.A Fisher
(c) Ya-Lun-Chou
(d) Boddington
Answer:
(d) Boddington
Question 3.
Sources of secondary data are:
(a) Published sources
(b) Unpublished sources
(c) Neither published nor unpublished sources.
(d) Both (a) and (b)
Answer:
(d) Both (a) and (b)
![]()
Question 4.
The data collected by questionnaires are:
(a) Primary data
(b) Secondary data
(c) Published data
(d) Grouped data
Answer:
(a) Primary data
Question 5.
A measure of the strength of the linear relationship that exists between two variables is called:
(a) Slope
(b) Intercept
(c) Correlation coefficient
(d) Regression equation
Answer:
(c) Correlation coefficient
Question 6.
If both variables X and Y increase or decrease simultaneously, then the coefficient of correlation will be:
(a) Positive
(b) Negative
(c) Zero
(d) One
Answer:
(a) Positive
![]()
Question 7.
If the points on the scatter diagram indicate that as one variable increases the other variable tends to decrease the value of r will be:
(a) Perfect positive
(b) Perfect negative
(c) Negative
(d) Zero
Answer:
(c) Negative
Question 8.
The value of the coefficient of correlation r lies between:
(a) 0 and 1
(b) 1 and 0
(c) -1 and +1
(d) -0.5 and +0.5
Answer:
(c) -1 and +1
Question 9.
The term regression was used by:
(a) Newton
(b) Pearson
(c) Spearman
(d) Galton
Answer:
(d) Galton
![]()
Question 10.
The purpose of simple linear regression analysis is to:
(a) Predict one variable from another variable.
(b) Replace points on a scatter diagram by a straight-line.
(c) Measure the degree to which two variables are linearly associated.
(d) Obtain the expected value of the independent random variable for a given value of the dependent variable.
Answer:
(a) Predict one variable from another variable.
Question 11.
A process by which we estimate the value of dependent variable on the basis of one or more independent variables is called:
(a) Correlation
(b) Regression
(c) Residual
(d) Slope
Answer:
(b) Regression
Question 12.
If Y = 2 – 0.2X, then the value of Y intercept is equal to:
(a) -0.2
(b) 2
(c) 0.2X
(d) All of the above
Answer:
(b) 2
![]()
Question 13.
In the regression equation Y = β<sub>0</sub> + β<sub>1</sub>, then Y is called:
(a) Independent variable
(b) Dependent variable
(c) Continuous variable
(d) None of the above
Answer:
(b) Dependent variable
Question 14.
In the regression equation X = β<sub>0</sub> + β<sub>1</sub>, then X is called:
(a) Independent variable
(b) Dependent variable
(c) Continuous variable
(d) None of the above
Answer:
(a) Independent variable
Question 15.
Econometrics is the integration of:
(a) Economics and Statistics
(b) Economics and Mathematics
(c) Economics, Mathematics and Statistics
(d) None of the above
Answer:
(c) Economics, Mathematics and Statistics
![]()
Question 16.
Econometric is the word coined by:
(a) Francis Galton
(b) RagnarFrish
(c) Karl Pearson
(d) Spearsman
Answer:
(b) RagnarFrish
Question 17.
The raw materials of Econometrics are:
(a) Data
(b) Goods
(c) Statistics
(d) Mathematics
Answer:
(a) Data
Question 18.
The term Uiin regression equation is:
(a) Residuals
(b) Standard error
(c) Stochastic error term
(d) None
Answer:
(c) Stochastic error term
![]()
Question 19.
The term Uiis introduced for the representation of:
(a) Omitted Variable
(b) Standard error
(c) Bias
(d) Discrete Variable
Answer:
(a) Omitted Variable
Question 20.
Econometrics is the amalgamation of:
(a) 3 subjects
(b) 4 subjects
(c) 2 subjects
(d) 5 subjects
Answer:
(a) 3 subjects
![]()
Samacheer Kalvi 12th Economics Notes Chapter 12 Introduction to Statistical Methods and Econometrics
→ Data: information about facts or numbers.
→ Standard deviation: The measures of central tendency serve to locate the centre of the distribution.
→ Mean: Central value is called a measure of central tendency or an average or a measure of locations.
→ Correlation: A statistical device that helps to analyse the covariation of two or more variables.
→ Regression: (Stepping back towards the average). It is the study of the relationship between the variables.
→ Econometrics: Integration of Economics, Statistics and Mathematics.
→ Statistics: Statistics is a grammar of science.
→ Econometrics:
“Econometrics may be defined as the social science in which the tools of economic theory, mathematics and statistical inference are applied to the analysis of economic phenomena” – Arthur S. Goldberger.
→ “Econometrics, as a result of certain outlook on the role of economics, consists of application of mathematical statistics to economic data to lend empirical support to the models constructed by mathematical economics and to obtain numerical results” – Gerhard Tinbergen.
→ Mean \(\begin{aligned}
\bar{X} &=\frac{X_{1}+X_{2}+X_{3}+X_{4}+\ldots .+X_{n}}{n} \\
&=\frac{1}{n} \sum_{i=1}^{n} X_{i}
\end{aligned}\)
→ Average Mean = \(\\bar{X}=\frac{X_{1}+X_{2}+X_{3}+\ldots X_{N}}{N}=\frac{\Sigma X}{N}\)
→ ΣX – Sum of all observations and
N – Total number of observations
![]()
→ Arithmetic Mean – Assumed Mean Method
\(\overline{\mathrm{X}}=\mathrm{A}+\frac{\Sigma f d}{\Sigma f}\)
→ Standard Deviation.
→ Individual series Standard deviation σ = \(\sqrt{\frac{\Sigma(\mathrm{X}-\overline{\mathrm{X}})^{2}}{n}}\)
→ Assumed Mean σ = \(\sqrt{\frac{\sum d^{2}}{n}}-\left(\frac{\Sigma d^{2}}{n}\right)\)
→ Karl Pearson’s Coefficient of Correlation r = \(\frac{\mathrm{N} \Sigma \mathrm{XY}-(\Sigma \mathrm{X})(\Sigma \mathrm{Y})}{\sqrt{\mathrm{N} \Sigma \mathrm{X}^{2}-(\Sigma \mathrm{X})^{2}} \sqrt{\mathrm{N} \Sigma \mathrm{Y}^{2}-(\Sigma \mathrm{Y})^{2}}}\)
→ Direct Method (r) = \(\frac{\Sigma X Y}{\sqrt{\Sigma X^{2} \Sigma Y^{2}}}\)
→ Assumed Mean (r) = \(\frac{\mathrm{N} \Sigma d x d y-(\Sigma d x)(\Sigma d y)}{\sqrt{\mathrm{N} \Sigma d x^{2}-(\Sigma d x)^{2}} \sqrt{\mathrm{N} \Sigma d y^{2}-(\Sigma d y)^{2}}}\)
→ Regression Equation X on Y
\((\mathrm{X}-\overline{\mathrm{X}})=r \times \frac{\sigma x}{\sigma y} \times(\mathrm{Y}-\overline{\mathrm{Y}})\)
→ Regression Equation Y on X
\((\mathrm{Y}-\overline{\mathrm{Y}})=r \times \frac{\sigma y}{\sigma x} \times(\mathrm{X}-\overline{\mathrm{X}})\)