Tamilnadu State Board New Syllabus Samacheer Kalvi 12th Business Maths Guide Pdf Chapter 9 Applied Statistics Ex 9.4 Text Book Back Questions and Answers, Notes.
Tamilnadu Samacheer Kalvi 12th Business Maths Solutions Chapter 9 Applied Statistics Ex 9.4
Question 1.
A time series is a set of data recorded
(a) Periodically
(b) Weekly
(c) successive points of time
(d) all the above
Solution:
(d) all the above
![]()
Question 2.
A time series consists of
(a) Five components
(b) Four components
(c) Three components
(d) Two components
Solution:
(b) Four components
Question 3.
The components of a time series which is attached to short term fluctuation is
(a) Secular trend
(b) Seasonal variations
(c) Cyclic variation
(d) Irregular variation
Solution:
(d) Irregular variation
Question 4.
Factors responsible for seasonal variations are
(a) Weather
(b) Festivals
(c) Social customs
(d) All the above
Solution:
(d) All the above
Question 5.
The additive model of the time series with the components T, S, C and I is
(a) y = T + S + C × I
(b) y = T + S × C × I
(c) y = T + S + C + I
(d) y = T + S × C + I
Solution:
(c) y = T + S + C + I
Question 6.
Least square method of fitting a trend is
(a) Most exact
(b) Least exact
(c) Full of subjectivity
(d) Mathematically unsolved
Solution:
(a) Most exact
Question 7.
The value of ‘b’ in the trend line y = a + bx is
(a) Always positive
(b) Always negative
(c) Either positive or negative
(d) Zero
Solution:
(c) Either positive or negative
![]()
Question 8.
The component of a time series attached to long term variation is trended as
(a) Cyclic variation
(b) Secular variations
(c) Irregular variation
(d) Seasonal variations
Solution:
(b) Secular variations
Question 9.
The seasonal variation means the variations occurring with in
(a) A number of years
(b) within a year
(c) within a month
(d) within a week
Solution:
(b) within a year
Question 10.
Another name of consumer’s price index number is:
(a) Whole-sale price index number
(b) Cost of living index
(c) Sensitive
(d) Composite
Solution:
(b) Cost of living index
Question 11.
Cost of living at two different cities can be compared with the help of
(a) Consumer price index
(b) Value index
(c) Volume index
(d) Un-weighted index
Solution:
(a) Consumer price index
Question 12.
Laspeyre’s index = 110, Paasche’s index = 108, then Fisher’s Ideal index is equal to:
(a) 110
(b)108
(c) 100
(d) 109
Solution:
(d) 109
Hint:
p²01 = 110; pp01 = 108
Fisher’s Ideal Index = \(\sqrt { 110×108 }\) = \(\sqrt { 11880 }\) = 108.99 = 109
Question 13.
Most commonly used index number is:
(a) Volume index number
(b) Value index number
(c) Price index number
(d) Simple index number
Solution:
(c) Price index number
![]()
Question 14.
Consumer price index are obtained by:
(a) Paasche’s formula
(b) Fisher’s ideal formula
(c) Marshall Edgeworth formula
(d) Family budget method formula
Solution:
(d) Family budget method formula
Question 15.
Which of the following Index number satisfy the time reversal test?
(a) Laspeyre’s Index number
(b) Paasche’s Index number
(c) Fisher Index number
(d) All of them.
Solution:
(c) Fisher Index number
Question 16.
While computing a weighted index, the current period quantities are used in the:
(a) Laspeyre’s method
(b) Paasche’s method
(c) Marshall Edgeworth method
(d) Fisher’s ideal method
Solution:
(b) Paasche’s method
Question 17.
The quantities that can be numerically measured can be plotted on a
(a) p – chart
(b) c – chart
(c) x bar chart
(d) np – chart
Solution:
(c) x bar chart
![]()
Question 18.
How many causes of variation will affect the quality of a product?
(a) 4
(b) 3
(c) 2
(d) 1
Solution:
(c) 2
Question 19.
Variations due to natural disorder is known as
(a) random cause
(b) non-random cause
(c) human cause
(d) all of them
Solution:
(a) random cause
Question 20.
The assignable causes can occur due to
(a) poor raw materials
(b) unskilled labour
(c) faulty machines
(d) all of them
Solution:
(d) all of them
Question 21.
A typical control charts consists of
(a) CL, UCL
(b) CL, LCL
(c) CL, LCL, UCL
(d) UCL, LCL
Solution:
(c) CL, LCL, UCL
Question 22.
\(\bar { x}\) chart is a
(a) attribute control chart
(b) variable control chart
(c) neither Attribute nor variable control chart
(d) both Attribute and variable control chart
Solution:
(b) variable control chart
![]()
Question 23.
R is calculated using
(a) xmax – xmin
(b) xmin – xmax
(c) \(\bar { x}\)max – \(\bar { x}\)min
(d) \(\bar {\bar x}\)max – \(\bar {\bar x}\)min
Solution:
(a) xmax – xmin
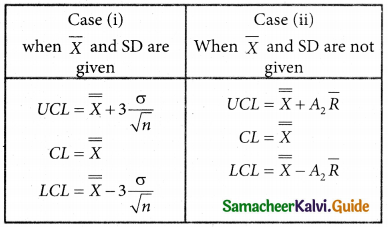
Question 24.
The upper control limit for x chart is given by
(a) \(\bar { x}\) + A2\(\bar { R}\)
(b) \(\bar {\bar x}\) + A2R
(c) \(\bar {\bar x}\) + A2\(\bar { R}\)
(d) \(\bar { x}\) + A2\(\bar {\bar R}\)
Solution:
(c) \(\bar {\bar x}\) + A2\(\bar { R}\)
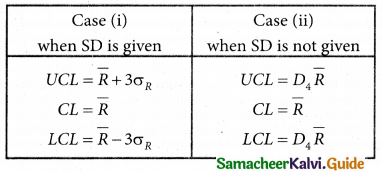
Question 25.
The LCL for R chart is given by
(a) D2\(\bar { x}\)
(b) D2\(\bar {\bar R}\)
(c) D3\(\bar {\bar R}\)
(d) D3\(\bar { x}\)
Solution:
(d) D3\(\bar { x}\)
![]()