Tamilnadu State Board New Syllabus Samacheer Kalvi 8th Maths Guide Pdf Chapter 6 Statistics Ex 6.2 Text Book Back Questions and Answers, Notes.
Tamilnadu Samacheer Kalvi 8th Maths Solutions Chapter 6 Statistics Ex 6.2
Question 1.
Which of the following data can be represented in a histogram?
(i) The number of mountain climbers in the age group 20 to 60 in TamilNadu.
Answer:
Yes
(ii) Production of cycles in different years.
Answer:
No
![]()
(iii) The number of students in each class of a school.
Answer:
No
(iv) The number votes polled from 7 am to 6 pm in an election.
Answer:
Yes
(v) The wickets fallen from 1 over to 50th over in a one day cricket match.
Answer:
Yes
![]()
Question 2.
Fill in the blanks:
(i) The total area of the histogram is _________ to the total frequency of the given data.
Answer:
proportional
(ii) A graph that displays data that changes continuously over the periods of time is _________ .
Answer:
Histogram
(iii) Histogram is a graphical representation of_________ data.
Answer:
grouped
![]()
Question 3.
In a village, there are 570 people who have cell phones. An NGO survey their cell phone usage. Based on this survey a histogram is drawn. Answer the following questions.
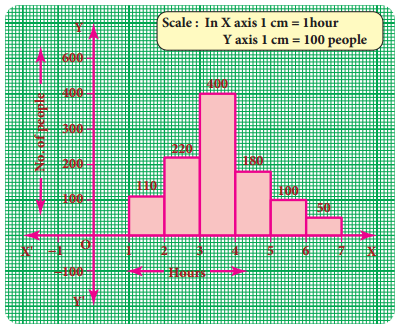
(i) How many people use the cell phone for less than 3 hours?
Answer:
330 people (110 + 220)
(ii) How many of them use the cell phone for more than 5 hours?
Answer:
150 of them (100 + 50)
(iii) Are people using cell phone for less than 1 hour?
Answer:
No
![]()
Question 4.
Draw a histogram for the following data.
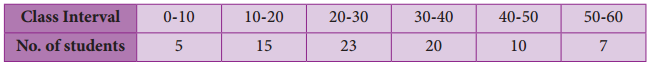
Answer:
The given (tata IS continuous frequency distribution taking class intervals on X axis and No. of students on Y-axis, the histogram is given below.
![]()
Question 5.
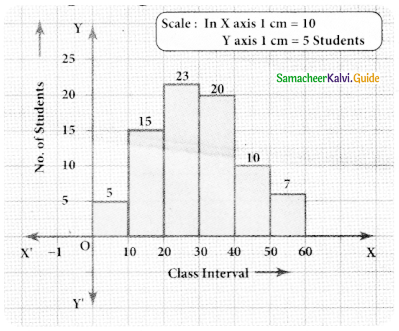
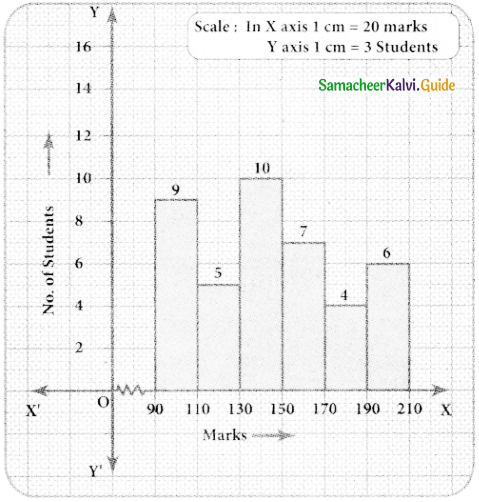
Construct a histogram from the following distribution of total marks of 40 students in a class.
Answer:
The given distribution is continuous taking marks on X axis and No. of students on Y-axis the histogram is constructed.
![]()
Question 6.
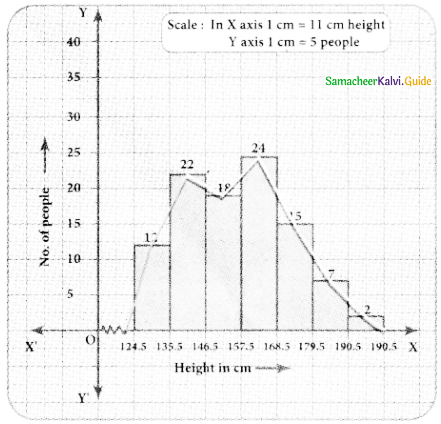
The distribution of heights (in cm ) of loo people is given below. Construct a histogram and the frequency polygon imposed on it.
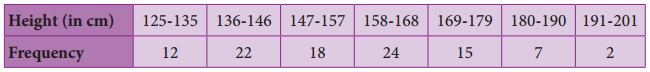
Answer:
The given distribution is discontinuous.
Converting into continuous distribution we have
Lower boundary = lower limit – \(\frac { 1 }{ 2 }\) (gap between adjacent class interval)
= 125 – \(\frac { 1 }{ 2 }\) (1) = 124.5
Upper boundary = Upper limit + \(\frac { 1 }{ 2 }\) (gap between the adjacent class interval)
= 135 + \(\frac { 1 }{ 2 }\) = 135.5
∴ The new frequency table is

![]()
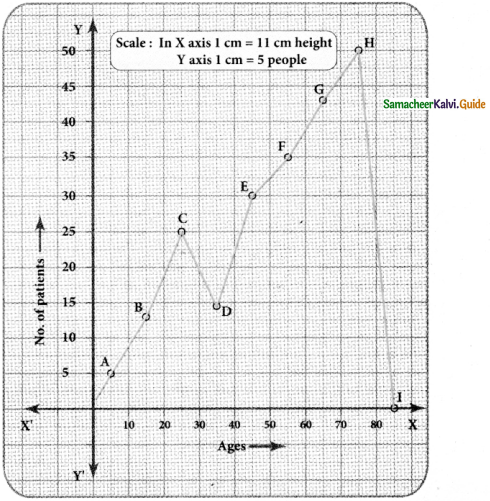
Question 7.
In a study of dental problem, the following data were obtained.
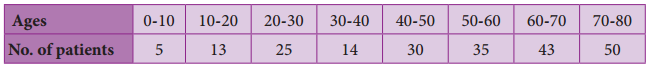
Represent the above data by a frequency polygon.
Answer:
Finding the midpoints of the class interval we get.
| Ages | Mid point (x) | No. of patients |
| 0 – 10 | 5 | 5 |
| 10 – 20 | 15 | 13 |
| 20 – 30 | 25 | 25 |
| 30 – 40 | 35 | 14 |
| 40 – 50 | 45 | 30 |
| 50 – 60 | 55 | 35 |
| 60 – 70 | 65 | 43 |
| 70 – 80 | 75 | 50 |
The points tobe plotted are A(5,5), B(15, 13), C(25, 25), D(35, 14), E(45, 30), G(65, 43.), H(75, 50) to obtain the frequency polygon ZABCDEFGHI.
Where I imagined class between 80 and 90.
![]()
Question 8.
The marks obtained by 50 students in Mathematics are given below (j) Make a frequency distribution table taking a class size of 10 marks (ii) Draw a histogram and a frequency polygon.
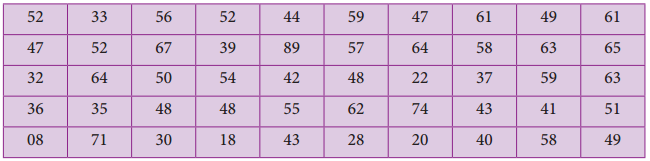
Answer:
Maximum marks obtained = 89
Minimum marks obtained = 08
Range = Maximum marks – Minimim marks
= 89 – 08
= 81
Taking the class size = 10, then
![]()
= \(\frac{81}{10}\) = 8.1 = 9
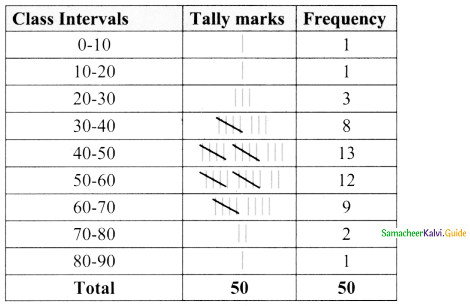
Now we have the continuous frequency table.

We will draw the histogram taking class interval in x-axis and frequency in y-axis as follows.
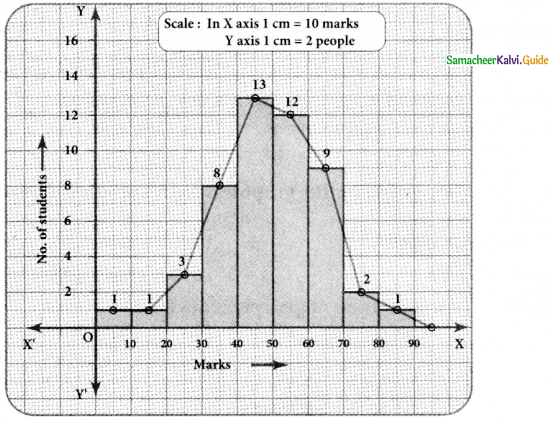
![]()
Objective Type Questions
Question 9.
Data is a collection of _________
(A) numbers
(B) words
(C) measurements
(D) all the three
Answer:
(D) all the three
Question 10.
The number of times an observation occurs in the given data is called _________
(A) tally marks
(B) data
(C) frequency
(D) none of these
Answer:
(C) frequency
![]()
Question 11.
The difference between the largest value and the smallest value of the given data is ________
(A) range
(B) frequency
(C) variable
(D) none of these
Answer:
(A) range
Question 12.
The data that can take values between a certain range is called_________
(A) ungrouped
(B) grouped
(C) frequency
(D) none of these
Answer:
(B) grouped
![]()
Question 13.
Inclusive series is a _________series.
(A) continuous
(B) discontinuous
(C) both
(D) none of these
Answer:
(B) discontinuous
Question 14.
In a class interval the upper limit of one class is the lower limit of the other class. This is _________ series.
(A) Inclusive
(B) exclusive
(C) ungrouped
(D) none of these
Answer:
(B) exclusive
![]()
Question 15.
The graphical representation of ungrouped data is ________
(A) histogram
(B) frequency polygon
(C) pie chart
(D) all the three
Answer:
(C) pie chart
Question 16.
Histogram is a graph of a ________ frequency distribution.
(A) continuous
(B) discontinuous
(C) discrete
(D) none of these
Answer:
(A) continuous
![]()
Question 17.
A _________ is a line graph for the graphical representation of the continuous frequency
distribution.
(A) frequency polygon
(B) histogram
(C) pie chart
(D) bar graph
Answer:
(A) frequency polygon
Question 18.
The graphical representation of grouped data is _________
(A) bar graph
(B) pictograph
(C) pie chart
(D) histogram
Answer:
(D) histogram